Tavafchian
University Library
Project Overview
Challenge
Services provided by the University of Trento libraries have the main role in the maintenance and diffusion of information through various resources. On the other hand, the University of Trento has around 16 thousand enrolled students and 600 professors, yet most of them are not benefiting from library services.
Objectives
Main research question
-
Why students and professors are not willing to benefit from university library services?
Main research objectives
-
Improve the students' and professors' experience with the library services.
-
Create awareness about the library services and resources.
Tools
Strategic tools
User-centric design
Participatory design
Qualitative research methods
Prototyping
Role
UX researcher, UX designer, Workshop designer & facilitator
Team
A group of 5 multinational HCI students with the supervision of 3 professors of Trento university.
Duration
A complete semester, 5 months
Step 1: Preparation
Overview
As a group of 5 HCI students, we started this project by conducting user research. Research enables us to dig deep into our understanding of users - not only their immediate frustrations but also their hopes, fears, abilities, limitations, reasoning, and goals. It lays essential foundations for creating solutions in later stages. It's also in line with our user-centered approach to the whole project. It's worthy to mention that the design process is not linear and there were some iterations among different steps while we were implementing it.
This preparation phase was to better understand the status quo of the library services and the way users are interacting with them. This phase worked as a foundation for the upcoming steps and helped us define our assumptions and main target group.
Virtual and on-the-spot Ethnography
we used virtual and on-the-spot ethnographies as the first step to experience the library services on our own and establish a deeper understanding of the current situation. The university has four main libraries in different parts of the city. Each team member was in charge of one of these branches, and I was responsible for the two main libraries.

Assumptions & target group
Analyzing the collected data through ethnography helped us establish basic assumptions and define our main target group. This understanding is needed to define the interview and focus group outline, also better define the personas in the next steps.
-
University students and professors are the main people who can get advantage of library services.
-
The main users are not using the library more as a study room than a source of information.
-
The university library website is not easy to use, and the users prefer to use alternative tools for their needs.
-
Since the university has four different libraries, more general information on them needs to be accessible for the users.
Step 2: Sympathy
Overview
The preparation helped us to establish a general understanding of the topic. Interviews and focus groups are the two other methodologies to dig deeper into users' needs and sympathize with them.
Interviews
An in-depth interview is a qualitative research method to understand users' needs, thought, frustration, feelings, and goals. The questions set is based on the research question and preparation phase results. These questions defined a general guideline that we followed in our semistructured interviews, focusing on establishing a natural conversation rather than strictly following the question set.
We defined three interview sets for each stakeholder based on the information we needed to collect. To define the questions, we considered the possible bias and avoiding leading questions.
To have a wide sample representation, we interviewed a range of subjects different for age, gender, job, nationality, and frequency of the library services' use. Overall we conducted 20 interviews with the students, professors as the core stakeholders, and library staff as the indirect stakeholder.
Transcribing all the interviews' recordings, we found the key results extremely correlated with the ones we discovered along with the ethnographic research, but we obtained a deeper knowledge upon them with the interviews.
Focus groups
The focus group aims to stimulate interactions among participants. It is a cost and time-effective method to collect data, involve the possible users in the design process. This method is successful when the subjects can discuss among each other, agreeing or disagreeing on the topic of interest and putting themselves in a discussion.
Starting from the problematic points we concluded from the interviews; we created a guideline for the focus group. The guiding line was mostly focused on stimulating conversation among the participants. The main target for the focus group was students. We wanted to have also professors participating. Unfortunately, the ones we invited were busy. Eventually, we had 7 students and library staff as our participants.
The one-hour and seven minutes meeting was recorded and later transcribed, and, as with the other methods, the data collected were analyzed. In this case, the information we gathered was even richer than with the other methods, and it provided a shared vision on problems and possible solutions with some interesting hints for further research.

Some controversial discussions
-
Comparison with other University libraries (comparison among Argentina, Iran, and Italy)
-
Problems related to the group workspaces (not enough space, lack of awareness about their existence, limitations in reserving rooms)
-
Lack of promotion of library services (how can we receive a complete overview about services provided by the library? Email? Website?)
-
Sharing knowledge among participants (get to know about services through the focus group)
Step 3: Analysis
Overview
Since the design process can't be linear, we analyzed the collected data after completing each methodological approach. Applying different methods helped us reach data saturation while facing a huge and complex set of descriptive data. In this step, I'll describe our data analysis approach and the process of defining personas and journey maps to sympathize with the users and understand their main pain points.
Inductive analysis
Applying an inductive approach, we search for themes in the data. Since we had a lot of descriptive data, each team member listed the mentioned criteria by conducting each research method, and as a team, we coded them to find repeating patterns.
.jpg)
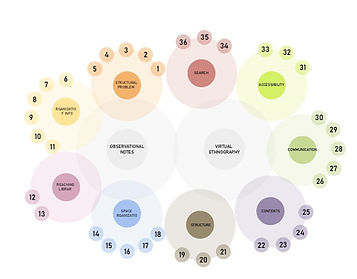
By this, we detected our four main improvement areas:
-
Make it easy for students to find and reserve a free sit in the library individually or as a group.
-
Update students and professors about upcoming events they can be interested in.
-
Make the process of finding an article more smooth for professors and students.
-
Making the general view of the website easier to follow. It's all about information hierarchy.
Personas
A persona is a design tool to represent the most possible customer profile based on user data, created to understand user characteristics, needs, and goals.
Based on the main pain points, we defined three personas and scenarios to better illustrate their needs, wishes, feeling, and thought. Each persona includes a name, avatar, and a quote that resemble it so the team can quickly remember. Additionally, scenarios elaborated more on each persona's needs and helped the team to sympathize more with them.


Journey maps
The user journey maps tell the interaction between a user and a service. They show a timeline of users' interaction with the services through a graphical representation of all phases and activities of the users' experience. For each phase, activities performed, the user's feelings during the path, and the level of satisfaction or frustration are always specified.
User journey maps helped us to generate ideas starting from existing critical issues and thinking of the steps needed toward our solutions. Each map is designed following a flow of realistic situations and is divided into moments, feelings, and activities told by our users and feelings they had in performing these experiences.

Competative benchmarking
At this stage of the process, we already established a deep understanding of the users' needs and the product's main issues. Benchmarking other university libraries was a valuable completion of our research process.
User experience (UX) benchmarking is an effective method to understand how people use and think about an interface. For any type of technological product, having this method is an essential part of a plan to systematically improve the UX (Sauro, 2018).
To ensure that the benchmarking is in line with our research goal, we defined measurable objectives based on the detected issues. To make the data even more comparable, we used a Likert scale for the subjective criteria. This step has been beneficial for us to develop ideas on how issues identified in UniTn libraries could be fixed.


Step 4: Ideate
Overview
We defined the main library issues at this stage, and the next step was to define innovative solutions to improve them. Since users are experts in their own experience, having them also involved in finding a solution is a valuable approach to this stage of the design process.
For this purpose, besides team discussion and brainstorming, we also conducted a workshop as a participatory approach to involve the users in the ideation phase of the design process.
Workshop
Workshops are structured meetings in which all the participants are active protagonists, animate the discussion, and share ideas to develop solutions. Since people might not be aware of their needs, feelings, or goals or be ashamed to share them, workshops propose some participatory exercises to discover how to talk about things they wouldn't have shared before.
The framework provided by Sanders, Brandt, and Binder (2010) to describe the tools and techniques of Participatory Design proved itself valuable in structuring this project research.
After deciding to put the workshop focus on the online part of the library services, we defined the following steps for the session:
- Intro: greeting and networking (with beverages and food)
- Warm-up part: activities to involve participants and make them feel comfortable
- Main part: activities to collect information through participants' behavior and insights;
- Conclusion: thoughts and feedbacks about the results and the workshop experience.
To get the fullest outcome of the workshop, the facilitator plays an important role. As the facilitator, I should be energetic, well prepared, active listener, observer, and easy-going. I also understood that a marvelous workshop results from perfect teamwork and established trust between the facilitator and participants.


Solutions
Thanks to the activities carried out during the workshop, especially the website user testing, we understood that the actual website limits a good user experience. Based on the insight of the whole research, the main points to redesign the website was as follow:
-
Making academically relevant events more visible, mainly to non-Italian speakers.
-
Showing the number of free seats inside the libraries on the University website to prevent students from wasting their time going to overcrowded study rooms.
-
Provide a section for group spot reservations on the website.
-
Improving the experience of using filters in search of a journal or an article in the discovering features of the University library website.
Step 5: Prototyping

Events
-
Horizontal parallax structure.
-
Include main event details:
time, location, topic, photo -
Show 3 events at a time.
-
Mouse over reveals more details.
Final thoughts
Project limitations
Similar to any other project, in this project we faced some limitations.
-
Hard to involve enough professors in the research process.
-
Limitation in the actual test of the solution.
-
Time limitation to focus more on the redesign of the filters and search box.
Future Improvement
-
The actual implementation of the solution considering the bureaucratic structure of the university.
-
Deep dive in user research for each pain point.
-
Redesign of the physical library services.
-
Considering accessibility in the redesign of the physical and online library services.
-
Tracking free spots in the library more systematically.
Project outcomes
-
Establish the basic structure to improve the university library services.
-
Define the most problematic issues with the library services.
-
Suggest the quickest solutions, considering the existing limitations.
-
Suggesting more inclusive solutions.
Personal outcomes
-
Team working and cooperation in a multicultural group.
-
Employing a user-centric and participatory design approach.
-
Applying qualitative research methods
-
Designing and facilitating the workshop
-
Improving my UX writing and presentation skills.
-
Improving my innovative problems solving skills, considering the limitations
Check my other projects

